
Navigate toolbar: [ Fish Diets | My Photos | Estuarine Research | FADs | Soniferous Fish | My CV | My Youtube | Children's Stories | Fish Facts | My Writings | Home Page ]
I recently had the pleasure of visiting the Honolulu Institute of Marine Biology located on Coconut Island in Kaneohe Bay off the island of Oahu. During my stay on the island I was surprised, and pleased, to learn that I was on the island of "Gilligan's Island" fame. Coconut Island is the island used in the opening credits during the 2nd and 3rd years of the show (see banner above) which aired in the early 1960's (those interested in learning more about the show are referred to the "Professor's" web page at {insert link} and related pages {insert links}). I was on the island to attend a workshop on "Underwater Passive Acoustic Monitoring for Remote Regions" hosted by the Hawaii-Pacific and Alaska Partners of the Alliance for Coastal Technologies (insert web page link) in February 2007. While on the island I took some time to explore the island and its fringing habitats and to record some underwater sounds. My purpose in posting this information is to provide a simple demonstration on how passive acoustic can be used in low-budget, low-tech applications to study fish ecology. Passive acoustics studies like this can be conducted on various scales of sophistication as part of public education, "civic science," undergraduate and graduate studies.
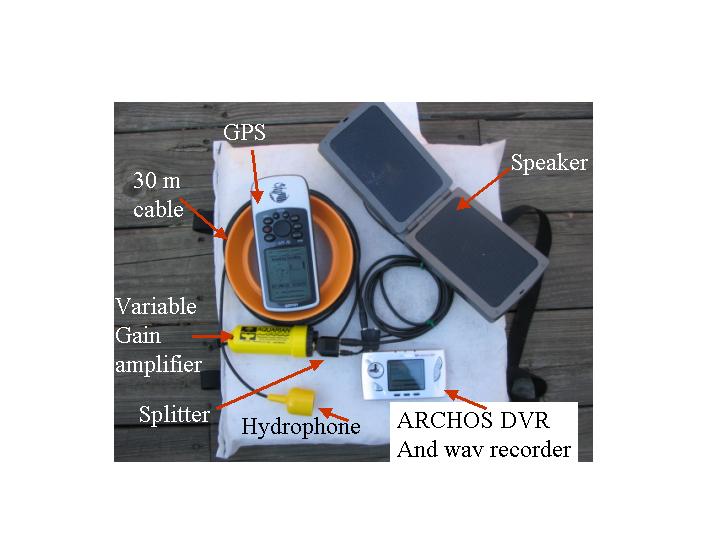 Figure 1. Equipment used in Hawaii |
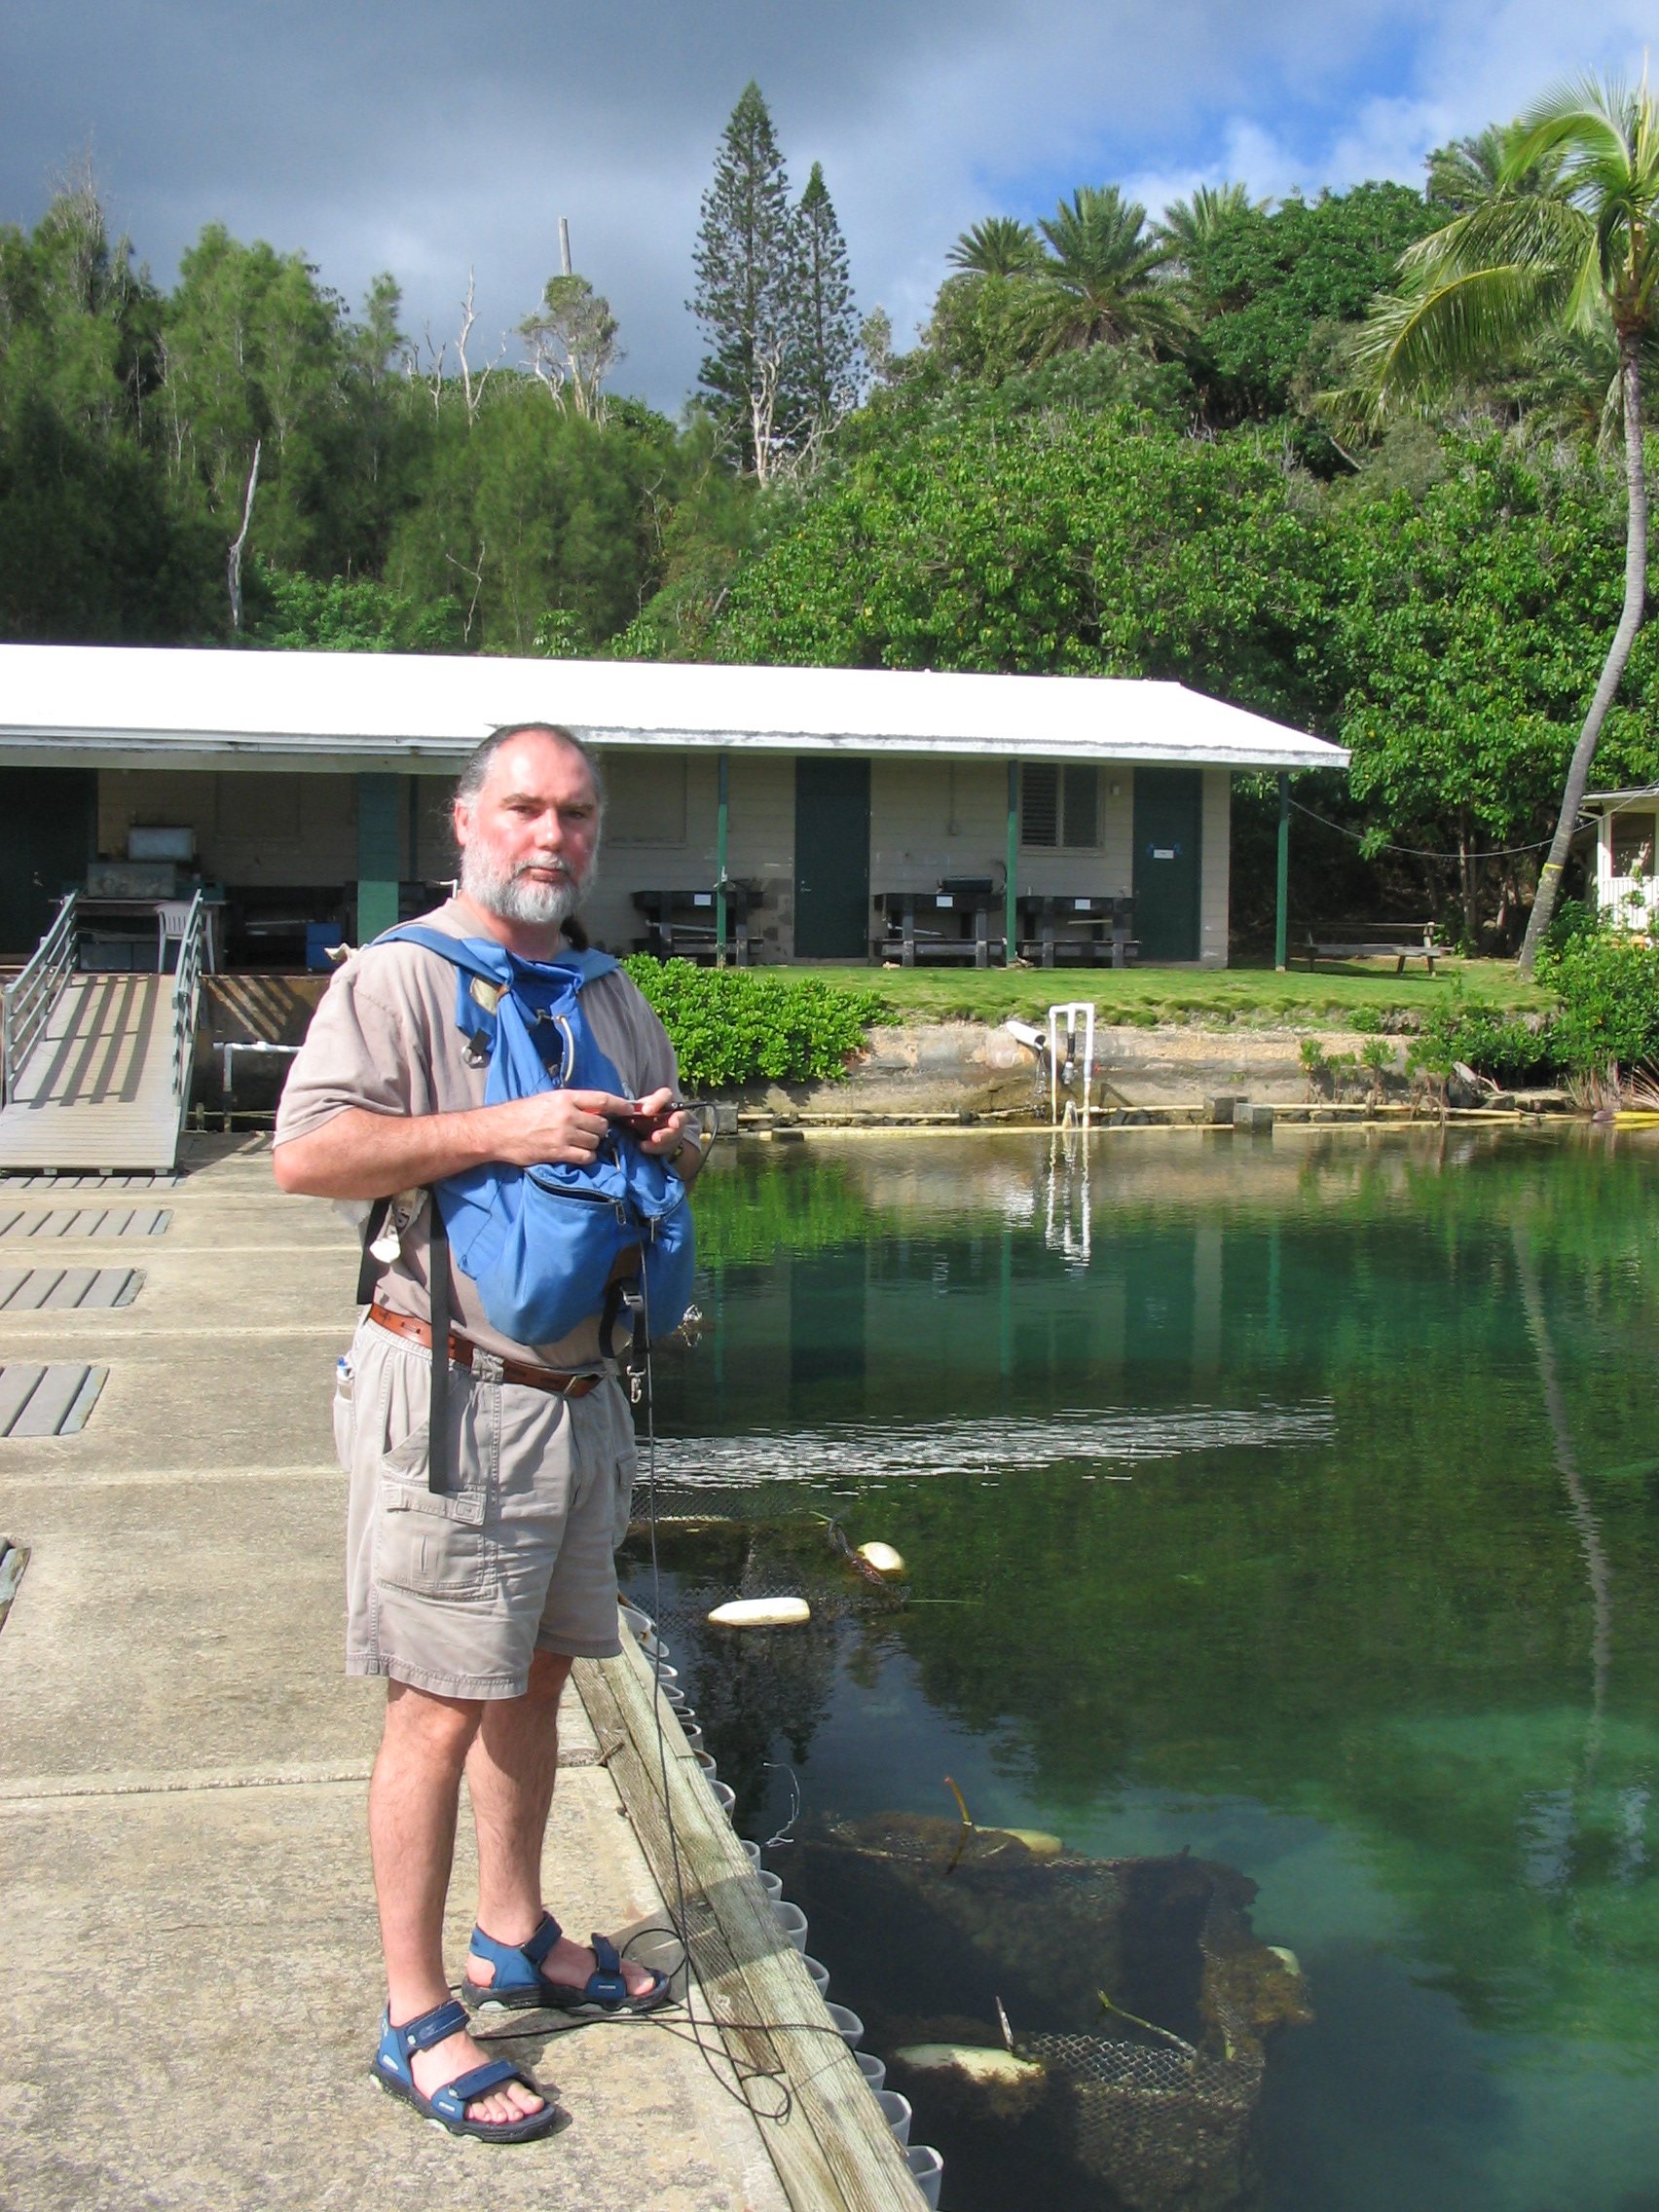 Figure 2. The passive acoustic equipment was easily carried in a backpack as I conducted a survey of the Island on foot. |
A simple survey of sounds can be carried out with some basic equipment (Fig. 1 and 2). Basically you need a hydrophone and a recorder of some type. Even a low quality, non-calibrated hydrophone can be useful in many circumstances. Especially during the initial exploratory phase, or when surveying temporal and low-resolution spatial characteristics of well known sounds. Many different types of recorders can be used, ranging from digital recorders to conventional desktop tape recorders. Regardless of the recording device used, investigators should be aware of the recorder's limitations. Many devices designed for human speech cut off the lower frequencies (below 120 Hz) that are often important biologically. Many digital devices now only record files to mp3 format which is compressed, and results in the loss of important acoustic data. Devices that record to wav format are preferred. It also helps to have a way to monitor sounds during recording to verify that the equipment is working properly. Headphones are useful in noisy areas, while amplified speakers are useful when more than one person is monitoring the sounds, or when the investigator does not wish to be encumbered by earphones. Monitoring sounds in real time allows one to make visual observations that may aid in sound identification. Although in some cases variable gain amplifiers for the hydrophone are useful, in most cases it is better to have a simple preamplifier to ensure standardized sampling.
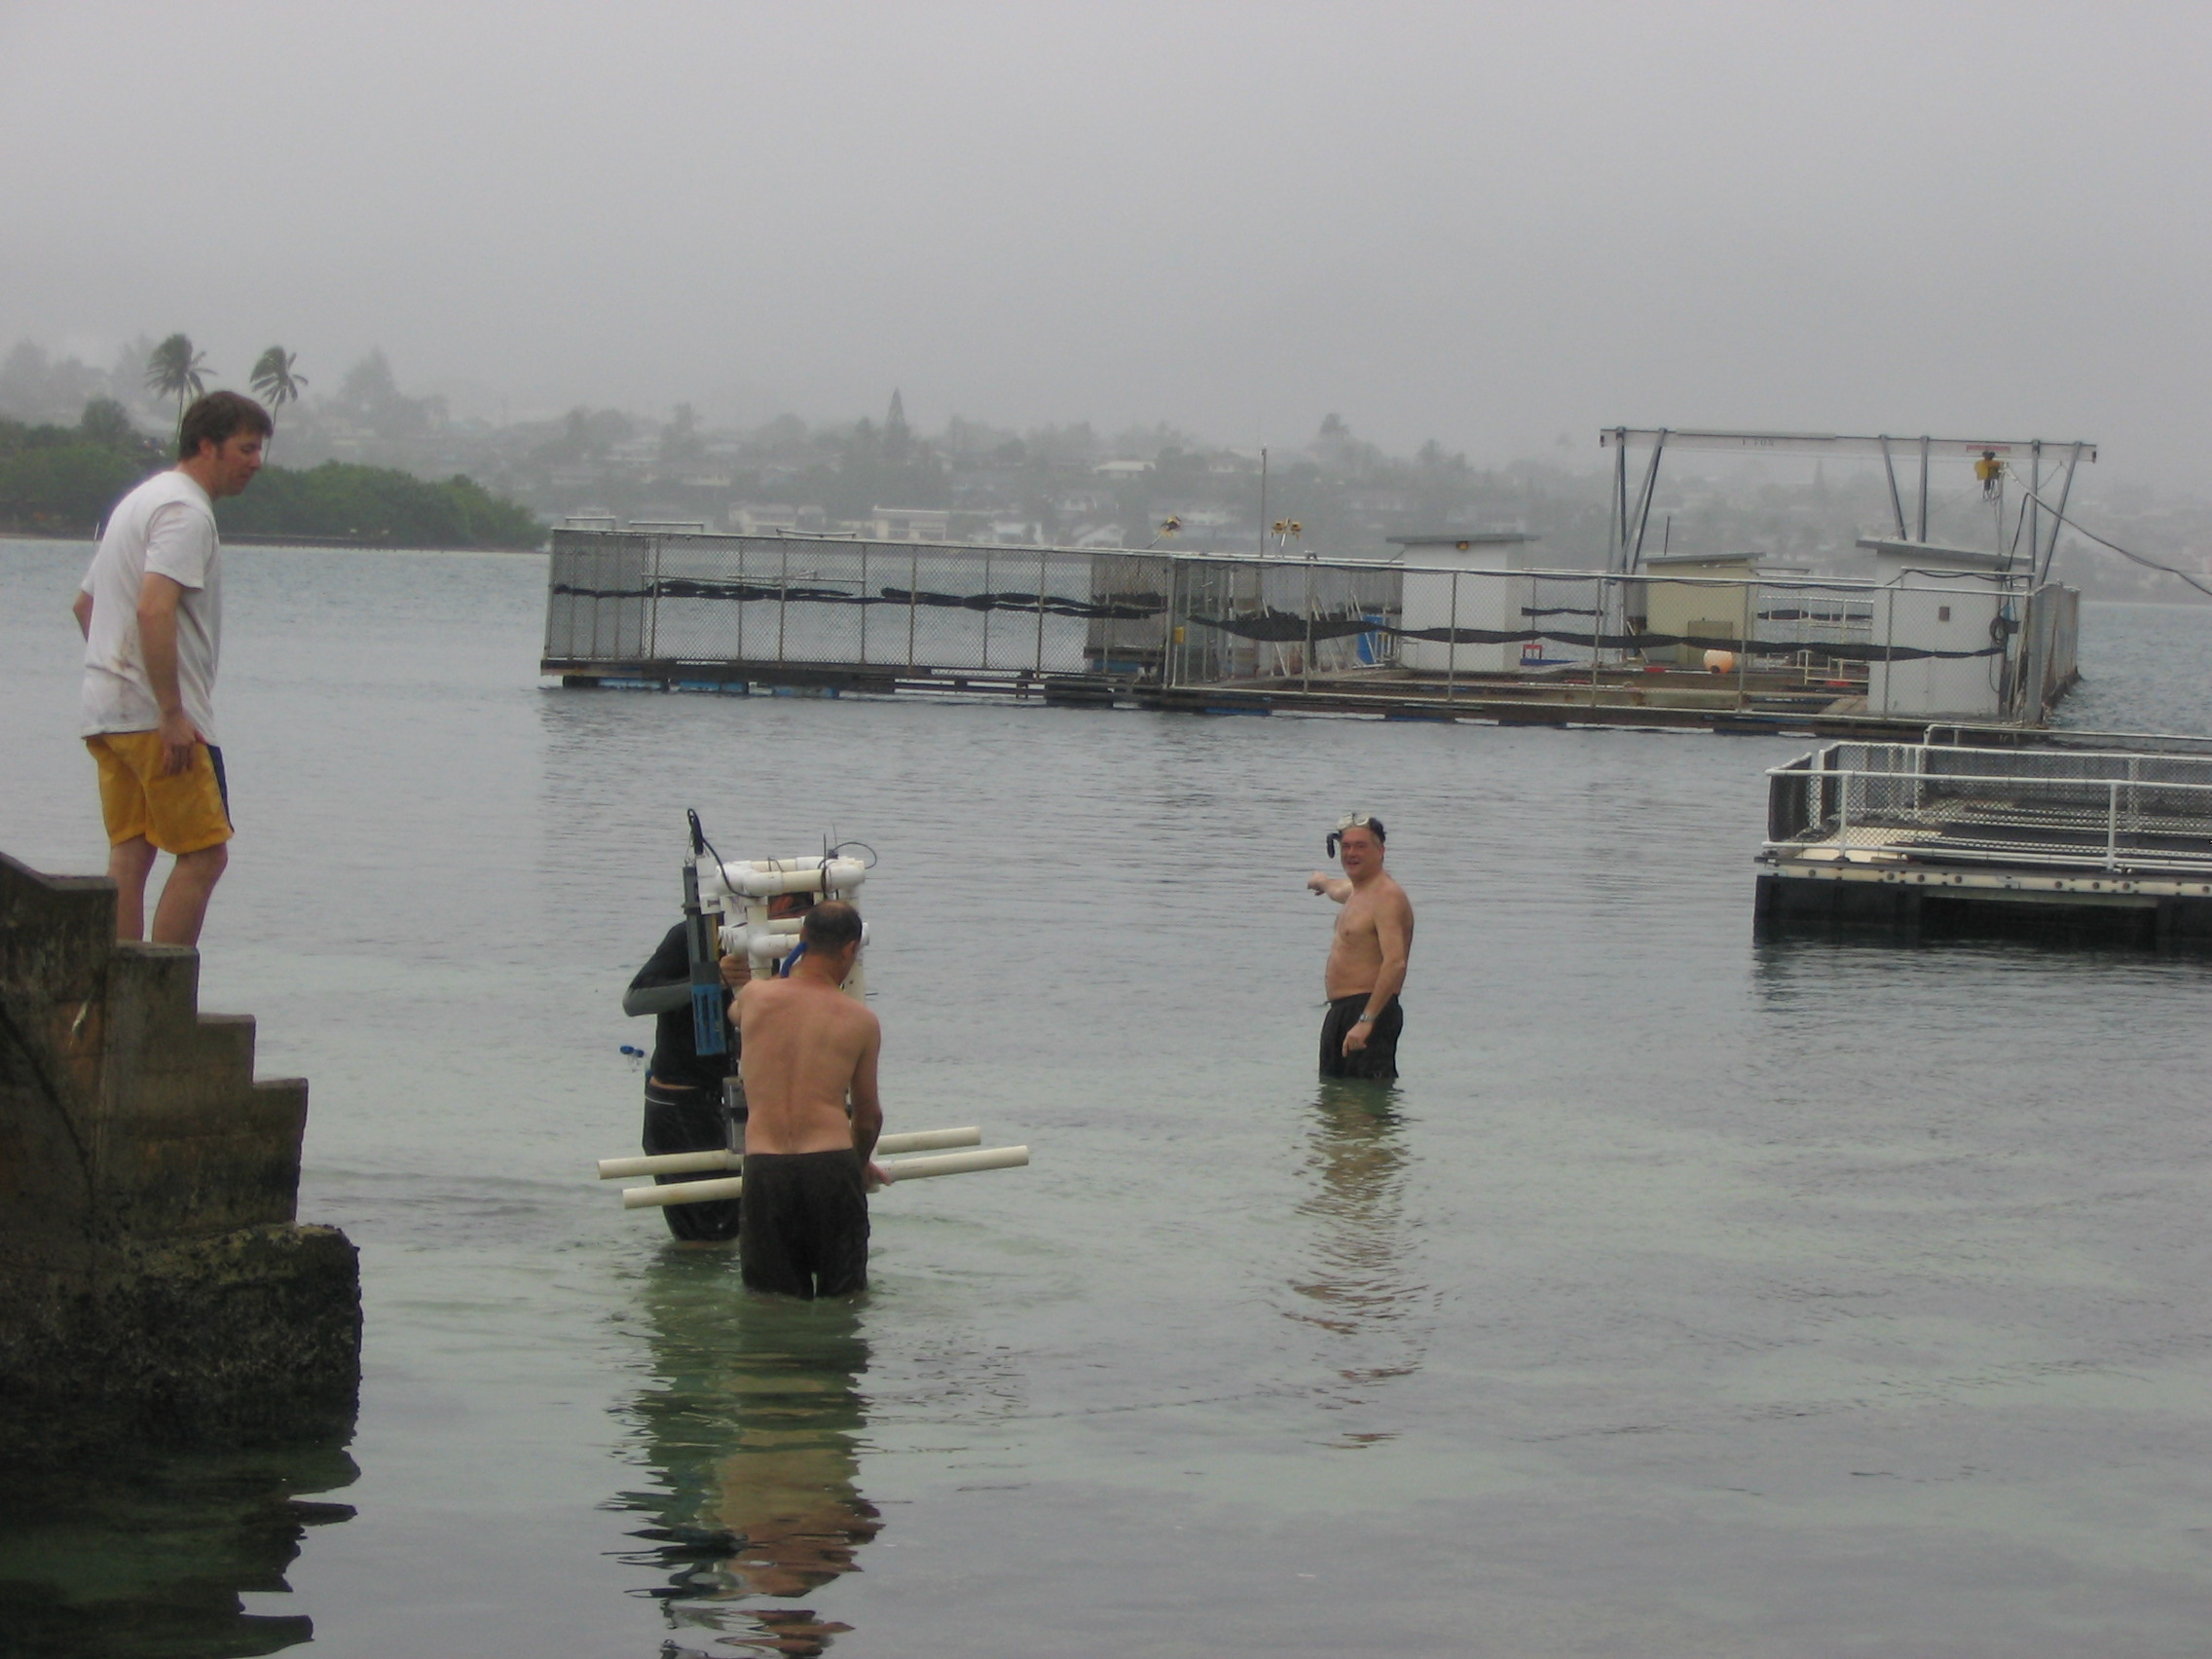
Sampling was conducted at various locations around the island over several days as shown in the site map (Figure 3), photos (Fig. 4) and Table 1. Sites 8 and 6 were sampled for several hours around sunset on Feb. 8th and 9th, respectively. On Feb. 10th, I conducted a roving survey to qualitatively sample background noise levels at all sites during the day. Site 16 was sampled in the evening of Feb. 10th on a last minute impulse before leaving the island. Site "F" was the site where Joe Luczkovich and Mark Sprague conducted a demonstration deployment of their F.A.B.U.L.U.S prototype. The FABULUS is a sophisticated environmental and acoustic data logger under development at East Carolina University (insert web page).
 Figure 3. Map of Gilligan's Island sample sites (stars). |
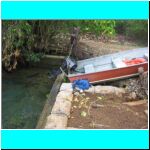
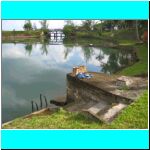
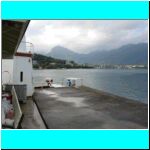
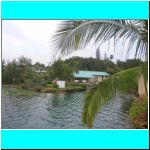
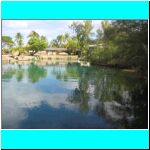
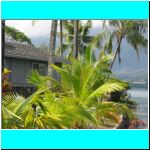
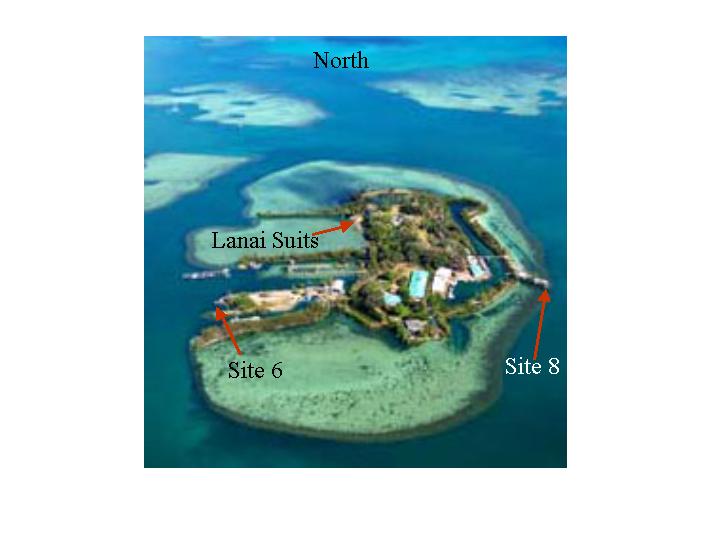 Figure 4. Click for views of Gilligan's Island. |
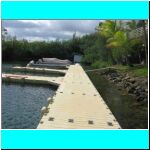 |
Site 1 | Latitude 21.43256667 |
Longitude 157.7877167 |
Docks in front of Marine Biology Lab |
 |
Site 2 | Latitude 21.43481667 |
Longitude 157.7893333 |
Lagoon in front of Lanai suites |
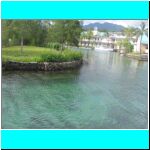 |
Site 4 | Latitude 21.43301667 |
Longitude 157.7867167 |
Southeast Lagoon Inlet middle |
 |
Site 5 | Latitude 21.4354 |
Longitude 157.78875 |
North Island swimming pond |
 |
Site 6 | Latitude 21.43185 |
Longitude 157.7904667 |
Lighthouse dock |
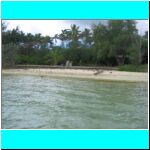 |
Site 7 | Latitude 21.43505 |
Longitude 157.7870833 |
Gilligan's beach northeast island |
 |
Site 8 | Latitude 21.43285 |
Longitude 157.7864 |
Southeast Lagoon inlet point |
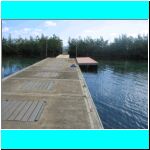 |
Site 10 | Latitude 21.43346667 |
Longitude 157.7871 |
Dock across east lagoon |
 |
Site 12 | Latitude 21.43168333 |
Longitude 157.7892667 |
Southwest boat cove |
 |
Site 14 | Latitude 21.4324 |
Longitude 157.7892833 |
Dock on cove in front of Whit's Lab |
 |
Site 16 | Latitude ND |
Longitude ND |
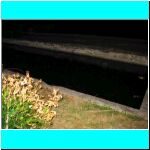
Bufo pond in front of Lanai |
 fabulus 2.JPG 686.72 KB |
Site F | Latitude 21.43291667 |
Longitude 157.7877167 |
ECU's Fabulus site |
After some exploratory listening on Feb. 7th, I decided to sample at the mouth of an inlet leading into a lagoon in the southeast part of the island (see site 8, in the location map Fig. 3 and 4 and Table 1). I began monitoring sounds at 5:43 pm local time well before sunset and ended at 8 pm. Nine recordings were made ranging from less than 2 minutes to 21 minutes in length. I was able to make visual observation of fish behavior and environmental conditions during acoustic monitoring. I watched a barracuda hanging around the mouth of the inlet and as it attacked large schools of chub as they began moving out of the lagoon at sunset. Of course, I also observed and recorded small boats entering and leaving the lagoon. Although I monitored long periods of quiet, there were many types of underwater sounds that I attribute to biological sources. Since I am not familiar with many of the tropical Hawaiian fishes nor of their sounds, I can not identify any of them. However, when conducting a preliminary study in a new area, observations on the location and timing of sounds can be used to develop sampling programs aimed at identifying unknown sound sources. Perhaps by catching fish and auditioning them in the lab, or by using in situ monitoring methods like those pioneered by Phil Lobel at Boston University. To give you a flavor for the types of things I heard, I have posted some samples here. I do the same for some of the other locations I sampled later on the Island. The number and types of sounds increased greatly after dark (about 8:30 pm), especially the popping sounds (also the snapping shrimp sounds of course). A strange "Dragging" sound started after dark and did not seem to be associated with wave action or tidal movements.
I conducted another sunset monitoring session the next day at site 6 at the boat dock by the old lighthouse. Sampling started at 6 pm and continued until 9:15pm. Ten recordings ranging from 1to 21 minutes were made. It rained on-and-off causing some equipment problems so some recordings were lost. The "frying pan" sound heard in many of these recordings, as well as those from other Gilligan's Island sites, are from snapping shrimp. The first recording in Table 3 is a good example.
| Sound clip | Description | Graphs |
 REC0010 (2)_snappingshrimpclip.wav 562.55 KB |
snapping shrimp |
_snappingshrimpclip spectra.bmp) rec0010 (2)_snappingshrimpclip spectra.bmp 1.12 MB _snappingshrimpclip spectrogram.bmp) rec0010 (2)_snappingshrimpclip spectrogram.bmp 1.12 MB _snappingshrimpclip waveform.bmp) rec0010 (2)_snappingshrimpclip waveform.bmp 1.12 MB |
|
REC0019 (2)_chicken.wav 281.29 KB |
Chicken sounds |
_chicken graphs.bmp) rec0019 (2)_chicken graphs.bmp 1.12 MB |
|
REC0019 (2)_fishjump.wav 120.53 KB |
Spash from fish jump |
_fishjump graphs.bmp) rec0019 (2)_fishjump graphs.bmp 1.12 MB |
|
REC0019 (2)_grunts.wav 93.79 KB |
Series of grunts |
_grunts graphs.bmp) rec0019 (2)_grunts graphs.bmp 1.12 MB |
|
REC0019 (2)_knockseries.wav 187.54 KB |
Series of Knocks |
_knockseries graphs.bmp) rec0019 (2)_knockseries graphs.bmp 1.12 MB |
|
REC0019 (2)_loudgrowl.wav 85.42 KB |
Loud growl |
_loudgrowl graphs.bmp) rec0019 (2)_loudgrowl graphs.bmp 1.12 MB |
|
REC0019 (2)_popper.wav 142.84 KB |
Popping sounds |
_popper graphs.bmp) rec0019 (2)_popper graphs.bmp 1.12 MB |
|
REC0019 (2)_weird3.wav 240.00 KB |
Unknown sound |
_weird3 graphs.bmp) rec0019 (2)_weird3 graphs.bmp 1.12 MB |
On my last day, I conducted a proxy of a roving survey of noise levels by recording short sound clips at various locations as I walked clockwise around the island (see Figure 4). This was only a crude qualitative effort since the gain of my system is unknown, and samples were not collected synoptically. I started at site 2 at 9:09 am and returned to site 2 at 11:40 am (see Table 2 below and Island map above, Fig. 4). Sound levels were very low in all locations, probably not significantly different if quantified. However, sound levels had increased somewhat at site 2 during the 2 ˝ it took to complete the survey (mostly snapping shrimp sounds). The unquantified sound levels were very low, with occasional spikes due to boat noise.
| Site | 2 | 5 | 7 | 8 | 9 | 10 | 11 | 12 | 6 | 14 | 2 |
| Time | 9:09am | 9:23 am | 9:38 am | 9:45 am | 9:56 am | 10:08 am | 10:30 am | 10:45 am | 11:05 am | 11:18 am | 11:40 am |
To give you a feel for how noise comparison can be made, I randomly selected 2 second clips from each sample in Table 4 to compare relative amplitudes. I then combined the samples into a composite sound file and graphed the waveform below (Fig. 6). (Listen to composite sound file). Site 12 was extremely quiet, while sites 2, 6 and 8 were the loudest (but is still very quiet).
Right before leaving the Island, I decided to make some recordings in a small concrete pond located in front of the Lanai Suites (Figure 2). The pond was filled with large toads, Bufo marinus, which were chorusing and spawning. I knew from hearing a seminar by Dr. Mac Given (Neumann College, Pennsylvania), that some frogs call underwater, especially when disturbed. That is they continue to call for mates underwater to reduce the risk of predation. So I thought I'd give it a try. I began sampling at 7:12 pm when the toads were well into chorusing and finished at about 7:30 pm. During this time I made a unrecorded observations, and recorded tow long sound files (9 min 30 sec and 8 minute). Numerous very low amplitude underwater sounds were heard of several types. Once type resembled the call made in air, but was lower in amplitude, however these calls were not coincident with above water calls (that is the hydrophone was not simply picking up the airborne sounds, the calls were being made underwater). However, in one case a call began underwater and then turned into an above water call audible to my ear, but not the hydrophone. I suspect that the toad surfaced during its call. The first calls to be heard were very low amplitude repeatative thump trains of about 0.3 s duration. Later, the underwater version of the much longer duration normal call was more frequently heard. I suspect this pattern resulted because the toads were initially disturbed by my presense.
| Sound recording | Description | Graphs thumbnail |
|
rec00034 (2) bufo jump.wav 79.37 KB |
Splash from toad jumping into the water |
 bufo jump.bmp) rec00034 (2) bufo jump.bmp 1.12 MB |
|
rec00034 (2) bufo uw call and burp.wav 92.59 KB |
Two types of underwater calls |
 bufo uw call and burp.bmp) rec00034 (2) bufo uw call and burp.bmp 1.12 MB |
|
rec00034 (2) bufo uw calls.wav 1.55 MB |
Two types of underwater calls |
 bufo uw calls spectra.bmp) rec00034 (2) bufo uw calls spectra.bmp 1.12 MB  bufo uw calls spectrogram.bmp) rec00034 (2) bufo uw calls spectrogram.bmp 1.12 MB  bufo uw calls waveform.bmp) rec00034 (2) bufo uw calls waveform.bmp 1.12 MB |
|
rec00035 (2) bufo uw calls.wav 777.46 KB |
Underwater calls |
 bufo uw calls spectra.bmp) rec00035 (2) bufo uw calls spectra.bmp 1.12 MB  bufo uw calls spectrogram.bmp) rec00035 (2) bufo uw calls spectrogram.bmp 1.12 MB  bufo uw calls waveform.bmp) rec00035 (2) bufo uw calls waveform.bmp 1.12 MB |
Return to: | TOP |
This page was last modified on Sept 25, 2007
Copyright © 1999, 2003, 2004, 2005, 2007 by Rodney Rountree. All rights reserved
Navigate toolbar: [ Fish Diets | My Photos | Estuarine Research | FADs | Soniferous Fish | My CV | My Youtube | Children's Stories | Fish Facts | My Writings | Home Page ]
 spectra.bmp)
 spectrogram.bmp)
 waveform.bmp)
 graphs.bmp)
 graphs.bmp)
 graphs.bmp)
 pops graphs.bmp)
 graphs.bmp)
 filtered graphs.bmp)
_rapid popping graphs.bmp)
 graphs.bmp)
_chicken graphs.bmp)
_growlat722pm graphs.bmp)
_dragging graphs.bmp)
_knocks graphs.bmp)
_clicktrain graphs.bmp)
_fishjumping graphs.bmp)